
Best Free Tools to Debug Web App Errors (2025 Edition)
Introduction
Web apps are constantly evolving, and so are the tools we use to build and debug them. Whether you’re dealing with a mysterious JavaScript error or a backend bug, having the right tools can save hours of frustration.
In this post, I’ll walk you through some of the best free tools to debug web app errors in 2025 — from browser-based consoles to cloud platforms and everything in between.
1. Chrome DevTools (Built-in)
If you’re a frontend developer, Chrome DevTools is your first stop for debugging.
Features:
- Real-time DOM inspection
- Network request monitoring
- JavaScript console
- Performance profiling
Access it using:
mathematica
Right-click→Inspect Element
orpress Ctrl + Shift + I (Windows)/Cmd + Option + I (Mac)
Pro tip: Use the “Sources” tab to set breakpoints and step through your code.
2. Firefox Developer Tools
A solid alternative to Chrome DevTools with unique features like:
- CSS Grid Inspector
- Accessibility Tree
- Request blocking
Shortcut:
arduino
F12orRight-click → Inspect
Why use it?
Great for checking cross-browser issues and more accurate CSS debugging.
3. Postman
Ideal for testing APIs. You can send REST, GraphQL, and SOAP requests with ease.
Use cases:
- Testing endpoints
- Sending custom headers and payloads
- Viewing response times and status codes
Example test:
json
GET /api/user HTTP/1.1
Host: yourwebapp.com
Authorization: Bearer <your_token>

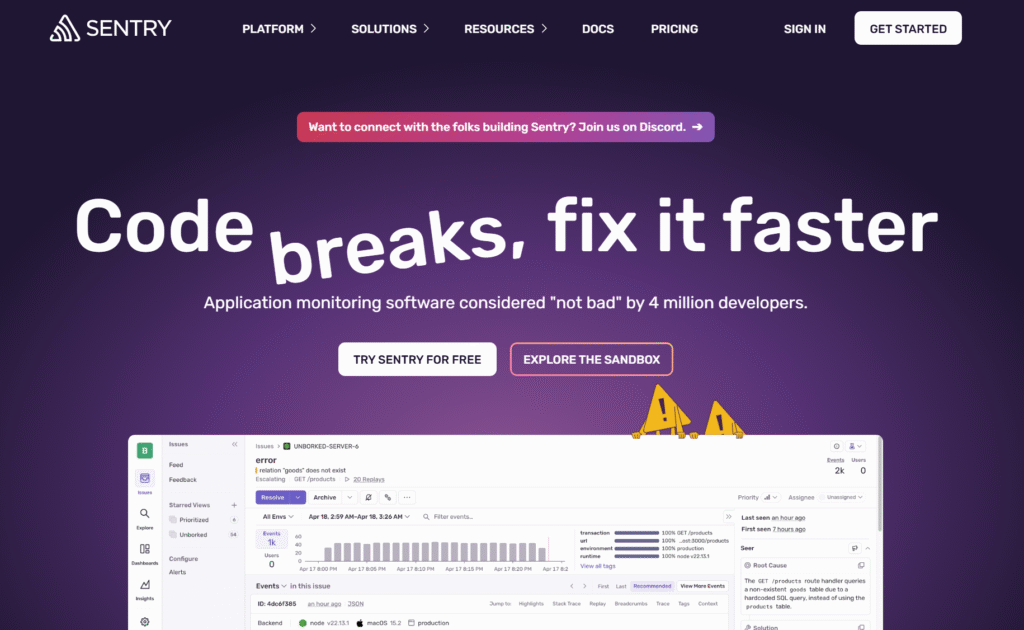
4. Sentry
A powerful cloud-based error tracking tool that gives insights into real-time bugs.
Free tier includes:
- 5,000 events/month
- Stack traces and breadcrumbs
- Source map support
Integrate with JavaScript like this:
html
<script src="https://browser.sentry-cdn.com/7.x.x/bundle.min.js" crossorigin="anonymous"></script>
<script>
  Sentry.init({ dsn: 'https://your-dsn@sentry.io/project-id' });
</script>
5. Vite Dev Server (Built-in Debugging)
If you’re using Vite for modern web app development, it comes with helpful logs and hot module replacement.
Key benefits:
- Instant updates
- Descriptive terminal logs
- Easy debugging with source maps
Run your app:
bash
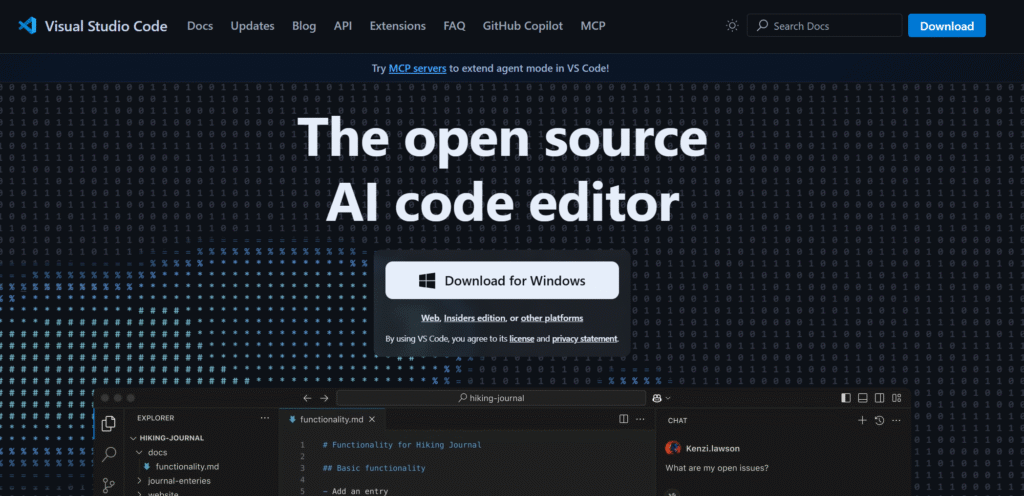
npm run dev6. VS Code Debugger
The built-in debugger in Visual Studio Code is robust and supports breakpoints, watch expressions, and step-through debugging.
To debug Node.js:
json
// .vscode/launch.json
{
  "type": "node",
  "request": "launch",
  "name": "Launch App",
  "program": "${workspaceFolder}/index.js"
}
Extensions to enhance debugging:
- ESLint
- Debugger for Chrome
- REST Client
🔗 https://code.visualstudio.com
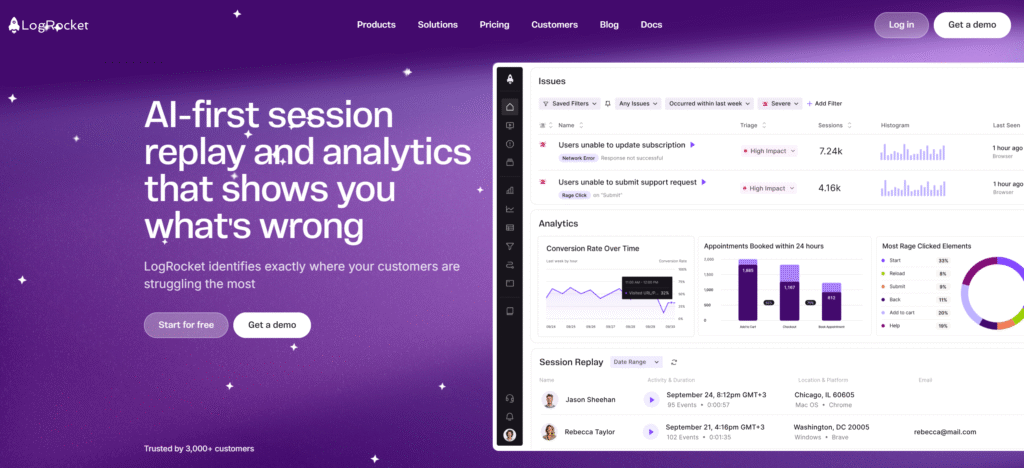
7. LogRocket (Free Tier)
LogRocket lets you replay user sessions to see exactly what went wrong.
Great for:
- UI/UX debugging
- Rage click detection
- Redux state tracking
React example integration:
javascript
import LogRocket from 'logrocket';
LogRocket.init('your-app-id');
8. GitHub Copilot & Code Suggestions
Now with Copilot Chat, GitHub offers contextual error explanation and suggestions.
You can ask:
Why is this function returning undefined?
It reads your code context and gives helpful debugging advice.
🔗 https://github.com/features/copilot

9. JSFiddle / CodePen / StackBlitz
Use these cloud IDEs for isolated testing of buggy code snippets.
- JSFiddle: Great for HTML/CSS/JS playgrounds
- CodePen: More design-focused
- StackBlitz: Simulates full-stack apps and frameworks
Quick setup example in JSFiddle:
html
<script>
  console.log('Debug me!');
</script>
10. BrowserStack (Free Plan)
Cross-browser testing across devices. Great when a bug appears “only on Safari iOS.”
Features:
- Live testing
- Real device cloud
- DevTools built-in
🔗 https://www.browserstack.com

📌 Final Thoughts
Debugging web apps in 2025 doesn’t have to be painful. With these free tools, you can trace, track, and fix errors faster than ever — whether it’s frontend, backend, or network-related.

